
Measuring software team effectiveness presents real difficulties. Developers often resist metrics, arguing that complex creative work cannot be reduced to simple measures like lines of code or completed tickets. Their concerns are justified—poor metrics can backfire, creating stress and degrading quality.
Surface-level metrics (bug counts, severity levels) fail to capture broader software delivery dynamics. Effective measurement requires a nuanced approach tracking how features move from concept to production, plus insights into release stability and quality.
Leadership must clarify measurement purposes and align them with business outcomes—maximizing use-value and quality. Metrics should reflect the outcomes you're trying to achieve.
Deming and Quality Philosophy
W. Edwards Deming, the "Father of Quality," pioneered statistical process control and continuous improvement. His post-WWII work transformed Japanese manufacturing from poor to high quality.
Deming warned against overreliance on numerical targets, noting that "management by numerical targets can encourage behaviors that sacrifice long-term quality." He emphasized that "It is not enough to do your best; you must know what to do and then do your best."
Key insight: Metrics must be considered holistically. Focusing on any single metric in isolation leads to short-sighted optimizations that harm overall system performance.
What Effectiveness Means
Effective software engineering achieves high-quality outcomes providing long-term value while maintaining sustainable development. Effectiveness involves:
- Consistency in Quality: Reliable software with minimal defects
- Efficient Processes: Short feedback cycles with rapid delivery
- Adaptability to Change: Reducing technical debt and enabling evolution
Three Key Metrics
Defect Density
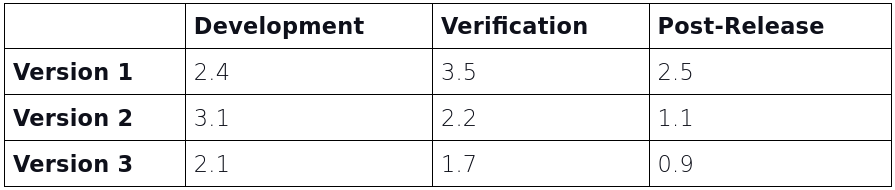
Defect density measures bugs per thousand lines of code (kLOC)—essential for understanding software stability across development, verification, and post-release phases.

Benchmarks:
- Verification phase above 2: Further testing needed before launch
- Post-release above 1: Immediate attention required
Defect density is a lagging indicator reflecting past issues. Component-level analysis (front-end, back-end, infrastructure) makes it actionable by directing team focus where needed most.
Patterns indicating problems:
- Post-release defects exceeding verification defects suggests insufficient testing
- Low development defects but high post-release defects indicates missed early issues
- Minimal defect reduction from verification to post-release points to inadequate testing coverage
Improvement strategies:
- Improve test coverage comprehensively
- Automate tests throughout the pipeline
- Create production-like test environments
- Implement continuous delivery
Cycle Time
Cycle time measures duration from task start to completion (typically deployment readiness). Shorter cycle times indicate efficiency; longer ones reveal bottlenecks.
Breaking down by phase reveals where delays occur:
- Development cycle time: From starting work until code merges to main branch
- Testing cycle time: From completion until passing all tests
- Deployment cycle time: From passed tests to production deployment
Tracking cycle time trends over releases shows whether improvements sustain or if new inefficiencies emerge.
Key consideration: Sudden cycle time drops might indicate corner-cutting rather than genuine improvement. Teams must distinguish between real, sustainable gains and temporary fixes.
Lead Time for Changes
Lead time for changes measures duration from code commit to production deployment—critical for assessing team responsiveness and agility. Shorter lead times enable faster feedback loops and adaptation.
Common measurement pitfalls:
- Inconsistent endpoints: Some teams start measuring from ticket creation, others from code commit. Standardization is essential. DORA recommends measuring from code commit to production deployment.
- Ignoring variability: Different components (front-end vs. infrastructure) experience different lead times. Breaking down by component reveals specific bottlenecks.
- Overlooking non-technical delays: Business approvals, requirement clarification, and resource constraints also impact lead time. Holistic measurement captures all delays.
- Sacrificing quality for speed: Rushing changes into production without adequate testing increases defects and customer dissatisfaction, undermining long-term success.
Component-level breakdown helps identify specific improvement opportunities. For example, back-end changes consistently taking longer might indicate complex dependencies requiring optimization.
A Continuous Improvement Framework
These three metrics interconnect—improving one often improves others. Together they create comprehensive visibility into bottlenecks and performance.
A data-driven approach ensures continuous improvement in both delivery speed and output quality. This feedback loop, combining leading and lagging indicators, drives long-term success.
Clear Benefits
Increased Visibility: Metrics expose efficiency, speed, and quality issues throughout the pipeline, enabling bottleneck identification.
Holistic Quality Management: Defect density monitoring prevents technical debt accumulation while supporting continuous improvement.
Faster, Reliable Releases: Shorter cycle and lead times accelerate feature delivery while improving responsiveness.
Better Resource Allocation: Component-level breakdowns direct efforts where most needed, optimizing system-wide performance.
Improved Collaboration: Clear metrics help engineering, QA, product, and operations align, reducing cross-functional bottlenecks.
Important Cautions
Speed versus Quality: Reducing lead or cycle time without considering defect density degrades quality. Rushing changes without sufficient testing increases defects and customer dissatisfaction.
Misinterpreting Metrics: Inconsistent definitions of cycle time and lead time produce false conclusions. Standardizing measurement points ensures accuracy.
Focusing on Averages: Average metrics obscure outliers and critical bottlenecks. Breaking down by task size and complexity provides nuanced views.
Ignoring Non-Technical Delays: If business approvals and requirement clarification aren't included in lead time calculations, teams may incorrectly identify purely technical bottlenecks.
Treating Metrics as Ends: Metrics serve continuous improvement, not as final goals. Improving metrics without understanding broader implications creates short-sighted optimizations.
Final Thoughts
Effective measurement of software teams requires thoughtful metric selection. Rather than tracking surface metrics, focus on comprehensive indicators like defect density, cycle time, and lead time for changes—balancing productivity with quality.
Leadership must ensure metrics align with organizational goals rather than serving as pressure points. Transparency, collaboration, and alignment with business outcomes enable teams to deliver value while maintaining excellence without burnout.
As Deming demonstrated, "quality and long-term success stem from consistent, thoughtful systems, not just the pursuit of speed."